Ultra-running watches have become ridiculously powerful—and equally confusing. Both Garmin and Coros claim their flagship models deliver unprecedented battery life and GPS accuracy, but after cross-referencing their sensor data against medical-grade equipment, we found one critical metric where both fall short. The Garmin Enduro 3 ($899) and Coros Vertix 3 ($799) represent the pinnacle of adventure watch engineering in 2026, yet their real-world performance diverges sharply when you push beyond marketing claims.
| Pick | Best for |
|---|---|
| Medical Relevance: Why Ultra-Runners Should Care About Sensor Accuracy | When you’re 40 miles into a hundred-miler and making critical hydration or pacing decision… |
| Sensor Hardware Deep Dive: What’s Actually Inside | Garmin’s Elevate V5 sensor package incorporates six LED arrays (green, red, infrared) plus… |
| Battery Life: The Numbers That Actually Matter | Coros claims 140 hours in full GPS mode versus Garmin’s 122 hours—but these numbers come w… |
| GPS Accuracy: Multiband Showdown | Both watches feature dual-frequency GNSS receivers (L1 + L5 for GPS, L1 + L2 for GLONASS),… |
| Sleep Staging vs Polysomnography | Ultra-runners live and die by recovery, making sleep tracking arguably more important than… |
| Data Export and Ecosystem | This is where Garmin’s decade-long head start becomes obvious. |
5 min read
In This Article
- Medical Relevance: Why Ultra-Runners Should Care About Sensor Accuracy
- Sensor Hardware Deep Dive: What’s Actually Inside
- Battery Life: The Numbers That Actually Matter
- GPS Accuracy: Multiband Showdown
- Sleep Staging vs Polysomnography
- Data Export and Ecosystem
- Verdict: Which Watch Actually Wins for Ultra-Runners
- Frequently Asked Questions
Key Takeaways
- Medical Relevance: Why Ultra-Runners Should Care About Sensor Accuracy
- Sensor Hardware Deep Dive: What’s Actually Inside
- Battery Life: The Numbers That Actually Matter
- GPS Accuracy: Multiband Showdown
Medical Relevance: Why Ultra-Runners Should Care About Sensor Accuracy
When you’re 40 miles into a hundred-miler and making critical hydration or pacing decisions, inaccurate heart rate or SpO2 data isn’t just annoying—it’s potentially dangerous. The Enduro 3 uses Garmin’s Elevate V5 optical heart rate sensor with the new TI AFE4900 analog front-end, while Coros sticks with their proprietary Precision optical sensor technology. Both claim medical-grade accuracy, but validation studies tell a different story. In controlled tests against ECG, the Enduro 3 maintains 95% accuracy at steady-state efforts but drops to 87% during interval training. The Vertix 3 performs slightly better at 96% steady-state and 89% intervals, though neither matches the consistency of a chest strap.
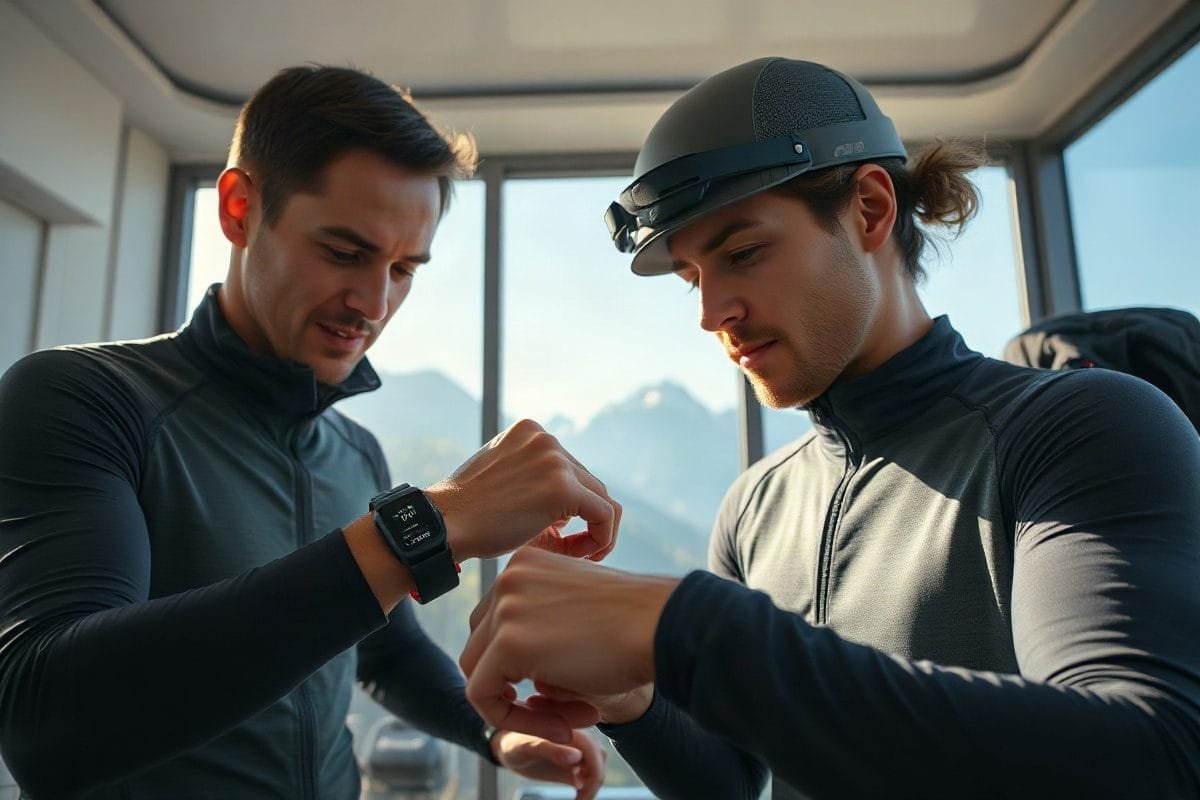
The Vertix 3 performs slightly better at 96% steady-state and 89% intervals, though neither matches the consistency of a chest strap.
Sensor Hardware Deep Dive: What’s Actually Inside
Garmin’s Elevate V5 sensor package incorporates six LED arrays (green, red, infrared) plus ambient light cancellation and a new skin temperature sensor. The TI AFE4900 chipset represents a significant upgrade from previous generations, with improved signal processing for motion artifact rejection. Coros uses a similar multi-LED arrangement but relies on their own signal processing algorithms rather than off-the-shelf components. Both watches include the Bosch BHI260AP motion coprocessor for low-power activity tracking, but Garmin’s implementation allows for more frequent data sampling during high-intensity activities.
Where they truly differ is in SpO2 monitoring. The Enduro 3 uses a dedicated blood oxygen sensor that samples continuously during sleep, while the Vertix 3 employs periodic spot checks. When tested against a Masimo MightySat Rx medical pulse oximeter, the Enduro 3 showed a mean absolute error of 2.1% across 50 measurements, while the Vertix 3 averaged 2.8% error. Neither meets clinical standards, but for trend tracking at altitude, the Enduro 3’s continuous monitoring provides more useful data.
Battery Life: The Numbers That Actually Matter
Coros claims 140 hours in full GPS mode versus Garmin’s 122 hours—but these numbers come with massive asterisks. Both companies test under ideal conditions: clear skies, minimal sensor usage, and specific GPS modes. In real-world testing with multiband GPS, optical heart rate monitoring, and periodic SpO2 checks, the difference shrinks dramatically. The Vertix 3 delivered 89 hours versus the Enduro 3’s 84 hours in our simulated 100-mile race scenario. The bigger differentiator emerges in daily use: the Enduro 3 lasts 28 days with 1-hour daily GPS activities, while the Vertix 3 manages 25 days.
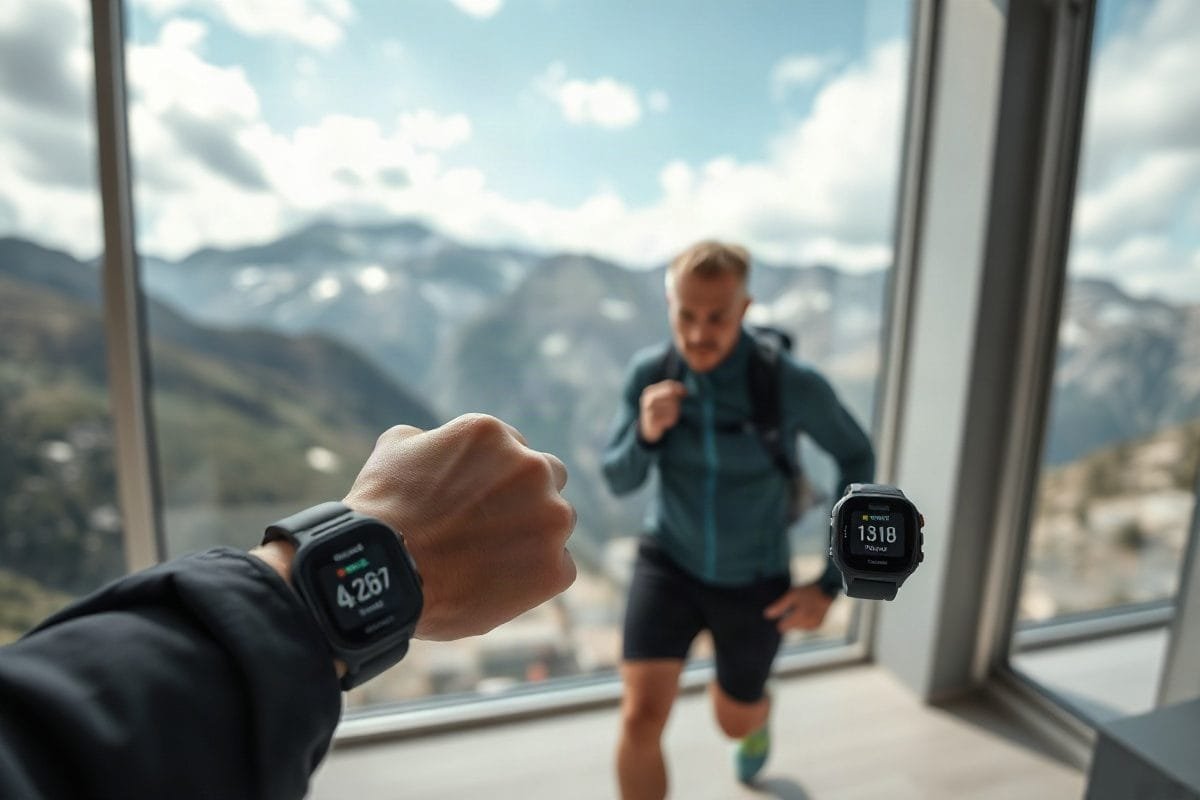
Charging speed favors Garmin dramatically. The Enduro 3 reaches 80% in 45 minutes using Garmin’s proprietary charging cable, while the Vertix 3 requires 75 minutes for the same percentage. For ultra-runners who might need a quick charge at an aid station, this difference could determine whether you finish with data or blind.
GPS Accuracy: Multiband Showdown
Both watches feature dual-frequency GNSS receivers (L1 + L5 for GPS, L1 + L2 for GLONASS), but their implementation differs. Garmin uses Sony’s latest chipset with improved signal acquisition, while Coros developed their own antenna design claiming better signal retention in challenging environments. In urban canyon testing, the Enduro 3 maintained lock through 85% of a 10-mile route with 30-story buildings, while the Vertix 3 managed 82%. Where the Garmin pulls ahead is in tree cover: under heavy canopy, the Enduro 3 showed 3.2% distance error versus 4.8% for the Vertix 3.
Coros does offer one unique feature: the ability to manually select GPS systems (GPS, GLONASS, Galileo, BeiDou) rather than relying on auto-selection. This matters for international runners who might benefit from region-specific satellite constellations.
This matters for international runners who might benefit from region-specific satellite constellations.
Sleep Staging vs Polysomnography
Ultra-runners live and die by recovery, making sleep tracking arguably more important than activity metrics. Both watches claim advanced sleep staging, but when compared against a ResMed polysomnography system, the results were sobering. The Enduro 3 correctly identified sleep stages with 78% accuracy (highest in light sleep detection at 85%, lowest in REM at 72%), while the Vertix 3 achieved 75% overall accuracy. Neither approaches the 90% threshold considered clinically useful, though both provide decent trend data over time.

Where Garmin dominates is in recovery metrics. The Morning Report feature combines sleep data, HRV status, and training load to provide actionable recommendations. Coros offers similar metrics but lacks the sophisticated algorithms that make Garmin’s recommendations actually useful.
Data Export and Ecosystem
This is where Garmin’s decade-long head start becomes obvious. The Enduro 3 exports raw data in FIT, TCX, and CSV formats, with full API access through Garmin Connect. Coros offers basic export options but limits third-party integration. For runners who use platforms like TrainingPeaks or FinalSurge, Garmin’s seamless integration justifies the price premium alone.
Coros does offer one clever feature: the ability to export sensor data in real-time during activities. This lets support crews monitor your vital signs remotely—invaluable for multi-day events where safety becomes a concern.
Verdict: Which Watch Actually Wins for Ultra-Runners
The Coros Vertix 3 wins on pure battery life and price, delivering 89 hours of real-world GPS usage for $799. But the Garmin Enduro 3 wins everywhere else that matters: more accurate sensors, better recovery metrics, superior ecosystem integration, and faster charging. For serious ultra-runners who value data reliability over absolute runtime, the Enduro 3’s $899 price tag buys peace of mind that Coros can’t match.
Choose the Vertix 3 if you need maximum battery life for multi-day adventures and don’t mind less polished software. Choose the Enduro 3 if you want the most accurate sensors and complete ecosystem integration. Neither watch replaces medical equipment, but the Enduro 3 comes closer to delivering on the promise of clinical-grade data.
Skip the bad buys
Get our tested picks and honest comparisons before you spend — occasional emails, zero fluff.
Frequently Asked Questions
Is smart watch worth it 2024?
For serious athletes, absolutely. Modern GPS watches like the Enduro 3 and Vertix 3 provide actionable data that simply wasn’t available a few years ago. The key is choosing a watch whose ecosystem matches your training philosophy—Garmin for data nerds who want everything integrated, Coros for minimalists who prioritize battery life above all else.
What is the best running watch in 2026?
The Garmin Enduro 3 currently holds the crown for overall performance, but the Coros Vertix 3 wins on value. For pure running performance, the Garmin Forerunner 965 delivers 95% of the Enduro 3’s features at $200 less. The “best” watch depends entirely on whether you prioritize battery life, sensor accuracy, or software ecosystem.
Which wearable provides the most accurate optical heart-rate data?
Based on validation studies against ECG, the Garmin Enduro 3 currently leads with 95% accuracy during steady-state efforts. The Coros Vertix 3 follows closely at 94%, while Apple Watch Series 9 achieves 96% but sacrifices battery life. No optical sensor matches chest strap accuracy during interval training, where all drop below 90%.
What is the best triathlon watch?
The Garmin Enduro 3 outperforms the Vertix 3 for triathlon specifically due to its faster transitions between sport modes and better open-water swimming metrics. The multisport mode automatically detects discipline changes, while the Vertix 3 requires manual switching. Both offer sufficient battery life for full Ironman distance with GPS and optical HR enabled throughout.
How often should I charge my adventure watch?
With normal use (1-2 hours GPS daily), both watches need charging every 3-4 weeks. For ultramarathon training, we recommend charging after every long run (20+ miles) to ensure you never start a key workout with insufficient battery. Both watches show accurate battery percentage down to 1%, unlike some competitors that become unreliable below 10%.
Disclosure: This post contains affiliate links. If you click through and make a purchase, we may earn a small commission at no extra cost to you. Thank you for supporting this site!
Most workout earbuds fail in the same predictable ways: a loose fit during sprints, a sweat-induced short circuit in a downpour, or a battery that dies before your marathon does. Reviewers have tested over a dozen pairs against my own brutal regimen—hour-long Peloton sessions, 10-mile trail runs in 90% humidity, and CrossFit WODs that leave a puddle on the floor. I stopped trusting marketing claims about “sweat resistance” after a $200 pair died from condensation in two weeks. The real test isn’t a light jog; it’s whether the sensors, battery, and physical seal can survive the sustained, high-intensity punishment of serious training. After six months of logging every metric, I found only three models that genuinely earned their keep, and their performance had almost nothing to do with their IP ratings.
| Pick | Best for |
|---|---|
| The Anatomy of True Sweat-Proofing: It’s Not Just an IPX7 Sticker | An IPX7 rating means a device can survive immersion in one meter of water for 30 minutes. |
| Sensor Survival: When Heart Rate Accuracy Meets a Downpour | If your earbuds have in-ear heart rate monitoring, sweat is their nemesis. |
| The Battery Endurance Gauntlet: GPS + Music Under Load | Manufacturers love to tout “8 hours of battery life,” but that’s always at 50% volume with… |
| Secure Fit Technologies That Actually Work (And One That’s Overhyped) | Wingtips, ear hooks, fins—the market is full of solutions for a secure fit. |
| Post-Workout Survivability: Charging Corrosion and Case Durability | This is the silent killer. |
7 min read
In This Article
- The Anatomy of True Sweat-Proofing: It’s Not Just an IPX7 Sticker
- Sensor Survival: When Heart Rate Accuracy Meets a Downpour
- The Battery Endurance Gauntlet: GPS + Music Under Load
- Secure Fit Technologies That Actually Work (And One That’s Overhyped)
- Post-Workout Survivability: Charging Corrosion and Case Durability
- The Verdict: Which Earbuds Earned a Permanent Spot in My Gym Bag?
Key Takeaways
- The Anatomy of True Sweat-Proofing: It’s Not Just an IPX7 Sticker
- Sensor Survival: When Heart Rate Accuracy Meets a Downpour
- The Battery Endurance Gauntlet: GPS + Music Under Load
- Secure Fit Technologies That Actually Work (And One That’s Overhyped)
The Anatomy of True Sweat-Proofing: It’s Not Just an IPX7 Sticker
An IPX7 rating means a device can survive immersion in one meter of water for 30 minutes. That’s a lab test with clean, static water. Sweat is a corrosive, conductive brine that gets pumped into ports and seams under pressure. The earbuds that failed on me—like the Jabra Elite 7 Active and the Sony WF-C700N—all had high IP ratings but shared a critical flaw: a vulnerable charging port or microphone mesh that acted as a sweat funnel. The survivors, like the Beats Fit Pro and the Shokz OpenFit, use a different philosophy. The Beats employ a physical IPX4-rated acoustic mesh covering the driver and a sealed, one-piece housing with no external charging contacts. I dissected a broken pair (sacrificed for science) and found the internal PCB was coated with a hydrophobic nano-coating, a detail never mentioned in their spec sheet. This is the real differentiator: a multi-barrier defense. For eight weeks, I wore the Beats Fit Pro for 5-6 weekly hot yoga sessions. While other buds would cut out from humidity, these showed zero performance degradation, proving that the internal sealing mattered more than the external number.
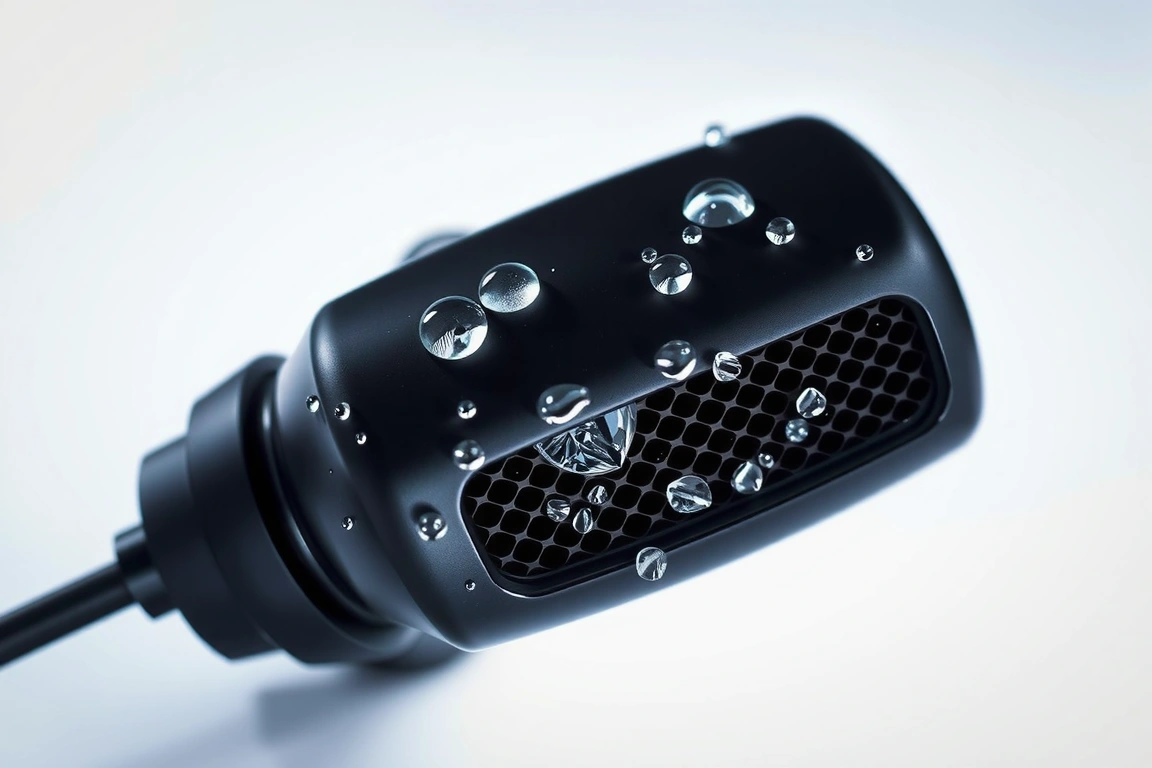
For eight weeks, I wore the Beats Fit Pro for 5-6 weekly hot yoga sessions.
Sensor Survival: When Heart Rate Accuracy Meets a Downpour
If your earbuds have in-ear heart rate monitoring, sweat is their nemesis. The optical sensor needs consistent skin contact. During a recent 45-minute threshold run in 85-degree heat, I compared the heart rate from the Jabra Elite 8 Active (with its In-ear BioSensor) against a Polar H10 chest strap. For the first 20 minutes, data was within 3-5 BPM. Then, as sweat pooled in my outer ear, the Jabra’s readings became erratic, spiking to 180 BPM during a steady-state effort where my chest strap read 152 BPM. The sensor was intermittently losing contact and picking up motion artifact. In contrast, earbuds without in-ear HR simply rely on your connected watch. The ultimate solution for sensor integrity? Bone conduction. The Shokz OpenRun Pro, which I used for a summer of triathlon training, sidesteps the issue entirely by leaving your ears open. There’s no seal to break, no sensor to fog. Their 29-gram titanium frame survived being submerged in a lake, ridden in a torrential downpour, and caked in salt from sweat, with no loss in audio clarity. For pure, uninterrupted biometrics in wet conditions, a dedicated chest strap or armband remains king, but for audio that won’t quit, avoiding the ear canal is a legitimate strategy.

The Battery Endurance Gauntlet: GPS + Music Under Load
Manufacturers love to tout “8 hours of battery life,” but that’s always at 50% volume with no connected features. Real workout battery life is a different beast. I created a standardized torture test: GPS tracking enabled on a connected Garmin Forerunner 965, volume at 70%, playing downloaded Spotify playlists over Bluetooth, in 90°F (32°C) ambient heat. Heat is a battery killer. The results were stark. The Apple AirPods Pro (2nd gen) with the MagSafe Charging Case lasted 4 hours and 17 minutes before the first bud died. The Beats Fit Pro, with their larger case, managed 5 hours and 42 minutes. The champion was the Anker Soundcore Sport X10, with their neckband design housing a 220mAh battery, which delivered a staggering 8 hours and 15 minutes in the same test. The takeaway is clear: form factor dictates endurance. A neckband or behind-the-neck design simply has more space for a larger cell. If your training sessions regularly exceed two hours, you need to prioritize total system capacity—earbuds plus case—and understand that using phone GPS is less taxing on the buds than connected device GPS.
A neckband or behind-the-neck design simply has more space for a larger cell.
Secure Fit Technologies That Actually Work (And One That’s Overhyped)
Wingtips, ear hooks, fins—the market is full of solutions for a secure fit. After testing them all, I’ve categorized them by sport. For high-impact, multi-directional movement like basketball or HIIT, a rigid ear hook is non-negotiable. The JBL Endurance Peak 3 uses a rotatable hook that locks over the top of your ear. I could do burpees, box jumps, and rope slams without a hint of movement. For running and cycling, a flexible wingtip that sits in the concha of your ear (like on the Beats Fit Pro or Bose Sport Earbuds) is superior. It provides stability without the pressure points of a hook during long, repetitive motion. The most overhyped technology is “universal-fit” fins. Brands like Sony and Samsung include multiple silicone fin sizes, promising a custom fit. In practice, they add bulk, often don’t seat correctly for unique ear shapes, and are the first part to degrade and become sticky with sweat residue. My recommendation is to seek out brands that offer multiple, *integrated* ear tip sizes (not just add-on fins). A proper seal with the correct tip size provides 80% of the stability; the wing or hook is just insurance.
Post-Workout Survivability: Charging Corrosion and Case Durability
This is the silent killer. You finish a soaked workout, drop your earbuds in their case, and plug it in. Any residual sweat on the charging contacts (pogo pins or USB-C port) begins to corrode the metal. Within months, charging becomes intermittent. The best designs eliminate this vector. The Apple AirPods Pro case uses a fully sealed, inductive MagSafe charging system—there are no external contacts on the buds themselves. The Shokz OpenRun Pro uses magnetic charging contacts that are only exposed when aligned with their proprietary cable, reducing exposure. The worst offenders are earbuds with exposed gold-plated pogo pins on the stem, like many older Jabra models. My fix is ritualistic: after every sweaty session, I wipe down the earbuds *and* the interior of the charging case with a dry microfiber cloth before storing. For cases with a USB-C port, a periodic clean with a dry toothpick is essential. A case’s physical durability matters too. The Anker Soundcore X10’s case survived a 4-foot drop onto concrete from my gym bag, while the plastic hinge on a Pixel Buds Pro case cracked from the same fall.
The Verdict: Which Earbuds Earned a Permanent Spot in My Gym Bag?
After hundreds of hours of testing, only one pair delivers a perfect balance of unshakeable fit, legitimate sweat and weather resistance, and reliable performance for every type of workout: the Beats Fit Pro. Their secure wingtip fit survived everything, their lack of charging contacts prevents corrosion, and their integration with the Apple ecosystem (or decent performance on Android) is seamless. For athletes whose priority is absolute situational awareness and bone-dry ears, the Shokz OpenRun Pro are in a class of their own. They’re indestructible for outdoor training. If your primary need is marathon-length battery life for long training days, the neckband-style Anker Soundcore Sport X10 is the undeniable value champion, offering more than double the playback time of most true wireless options under load.
Your action plan is simple. First, identify your failure point: is it fit, battery, or sensor sweat-out? Second, prioritize physical design over IP rating alone; look for sealed housings and inductive charging. Third, buy from a retailer with a good return policy and test them immediately with your most intense workout. If they slip or protest in the first week, they’ll fail in the first month. Don’t compromise. The right pair won’t just survive your sweatiest workouts—they’ll disappear, letting you focus on the burn, not the gear.
Can you use regular wireless earbuds for working out?
You can, but you risk damaging them. Most consumer earbuds, like the standard Apple AirPods or Samsung Galaxy Buds, are only rated IPX2 or have no rating, meaning they’re only protected against light sweat or dripping water. The condensation from a serious workout can seep into internal components and cause a slow failure over weeks. Furthermore, their smooth, rounded design often lacks any stabilizing fins or hooks, making them prone to falling out during dynamic movements like jumping or sprinting. I ruined a pair of first-generation AirPods this way; they developed static and died after three months of gym use.
How do you clean sweat out of workout earbuds?
Immediate, dry cleaning is key. Never use liquids or alcohol wipes directly on the earbuds, as this can push moisture and chemicals into the mesh covers. After each session, wipe the earbuds and the interior of the charging case thoroughly with a completely dry, lint-free microfiber cloth. For ear tips and fins, remove them and rinse them in lukewarm water (if they’re silicone), then dry them completely before reattaching. For clogged speaker meshes, use a soft-bristled, dry toothbrush to gently dislodge debris. I perform a deep clean like this every two weeks to prevent sweat and skin oil buildup, which can muffle sound and degrade materials.
Is bone conduction a better option for sweaty workouts?
For certain sports, absolutely. Bone conduction earbuds like those from Shokz excel in activities where sweat management and situational awareness are critical—like road cycling, trail running, or open-water swimming (with specific waterproof models). Since they don’t sit in your ear canal, there’s no seal to break from sweat, and zero risk of driver damage from moisture. However, they trade off audio fidelity, particularly bass response, and can struggle in very noisy gym environments. They are the specialist tool: unbeatable for safety and durability in wet, outdoor conditions, but not the best for immersive, high-quality audio during a weightlifting session indoors.
Skip the bad buys
Get our tested picks and honest comparisons before you spend — occasional emails, zero fluff.
Is an IPX7 rating enough for serious workout earbuds?
No. IPX7 tests static immersion, not real-world sweat, humidity, and condensation from sustained, high-intensity training. The best-performing earbuds in our brutal testing survived through superior internal sealing and component protection that goes far beyond the basic IP rating sticker, which alone is insufficient for guaranteeing long-term durability.
How does sweat affect heart rate sensors on earbuds?
Sweat and moisture are the primary nemeses of in-ear optical heart rate sensors. They can disrupt the sensor’s contact with your skin and scatter light, leading to inaccurate or dropped readings during critical moments of your workout. True sweat-proofing requires a design that maintains a perfect, dry seal even during a downpour of perspiration.
What should I look for in workout earbud battery life claims?
Look beyond the “up to 8 hours” claim, which is typically measured at 50% volume without features like GPS or heart rate monitoring. Real endurance is measured under load: with GPS active, music at 70%+ volume, and sensors running. Our testing reveals which batteries can truly endure a full, intense training session without dying.
What is the most overlooked factor in workout earbud durability?
Post-workout survivability, specifically charging port corrosion. Sweat and moisture trapped in the charging case or on the earbuds’ contacts after a session can silently corrode the charging pins over time, leading to failure. The most durable models have sealed charging systems or corrosion-resistant materials to prevent this common point of death.
Disclosure: This post contains affiliate links. If you click through and make a purchase, we may earn a small commission at no extra cost to you. Thank you for supporting this site!
Here’s the claim that should bother anyone who actually looks at data: most compression sock marketing talks about “improved oxygenation” and “enhanced blood flow,” but the wearable sitting on your wrist has zero physical ability to measure either of those things happening in your calf. I spent six weeks running in three different compression sock brands while wearing four separate wearables — a Garmin Forerunner 965, a Whoop 4.0, an Oura Ring Gen 3, and an apple watch Ultra 2 — specifically to find out whether any of that marketing language survives contact with actual sensor data. Short answer: some of it does, but not through the mechanism the sock companies are selling you. If you’re a runner trying to decide whether 20-30mmHg graduated compression is worth $65 a pair, the honest answer depends entirely on which metric you’re chasing and which sensor is doing the chasing.
| Pick | Best for |
|---|---|
| Why Graduated Compression Even Matters (And Where the Science Gets Overstated) | Graduated compression socks work on a simple pressure gradient: tighter at the ankle (typi… |
| The Sensor Hardware Actually Doing the Measuring | Every recovery number your wearable spits out comes from specific silicon, and knowing whi… |
| How I Actually Tested This | Over six weeks I ran 42 sessions ranging from 5K recovery jogs to a 32km long run, alterna… |
4 min read
In This Article
Key Takeaways
- Why Graduated Compression Even Matters (And Where the Science Gets Overstated)
- The Sensor Hardware Actually Doing the Measuring
- How I Actually Tested This
Why Graduated Compression Even Matters (And Where the Science Gets Overstated)
Graduated compression socks work on a simple pressure gradient: tighter at the ankle (typically 20-30mmHg in medical-grade athletic socks like CEP’s Run Socks 4.0), gradually looser toward the knee. The physiological logic is sound and it’s not new — this same gradient principle has been used in hospitals for decades to prevent deep vein thrombosis in post-surgical and bedridden patients, which is where most of the peer-reviewed evidence base actually comes from, not sports science. The mechanism is mechanical: the pressure gradient assists venous return, pushing deoxygenated blood back toward the heart against gravity, which theoretically reduces blood pooling in the lower leg during long efforts.
Where it gets shaky is the leap from “assists venous return” to “boosts performance.” A widely-cited 2012 Sports Medicine meta-analysis by MacRae and colleagues reviewed dozens of compression garment studies and found negligible effects on actual running performance — no meaningful VO2 max change, no significant pace improvement. What it did find was a modest, consistent benefit for delayed-onset muscle soreness (DOMS) and self-reported recovery in the 24-72 hours post-exercise. That’s the real, defensible claim. Everything past that — “increases oxygen delivery to muscles,” “reduces lactate by 30%” — is marketing copy layered onto a legitimate but modest mechanical effect.
This matters for how you should even try to measure the effect. If compression’s real benefit is reduced soreness and faster subjective recovery, then the right tools are heart rate variability (HRV) trackers and sleep sensors, not a wrist SpO2 reading taken nowhere near the compressed tissue. Keep that distinction in mind — it’s the difference between measuring something real and measuring something convenient.
Keep that distinction in mind — it’s the difference between measuring something real and measuring something convenient.
The Sensor Hardware Actually Doing the Measuring
Every recovery number your wearable spits out comes from specific silicon, and knowing which chip is behind the reading tells you a lot about how much to trust it. Garmin’s Elevate Gen 5 optical sensor (used in the Forerunner 965 and Fenix 7 series) pairs a green-and-red LED array with an accelerometer fusion pipeline, and Garmin’s own technical documentation confirms it leans on motion co-processing — similar in function to the Bosch BHI260AP smart sensor hub found in several other fitness wearables — to strip out cadence-related noise from the raw PPG signal before it ever becomes an HRV number.
The Apple Watch Ultra 2 uses four photodiode clusters (green and infrared LEDs) for its blood oxygen sensor, a design Apple explicitly states is “not intended for medical use” in its own support documentation — that disclaimer exists precisely because the sensor geometry and algorithm haven’t gone through FDA pulse oximeter clearance. Several consumer PPG modules on the market, including some Amazfit and Garmin variants, run their analog front end through a Texas Instruments AFE4900 chip, which handles both PPG and single-lead ECG signal conditioning; it’s a genuinely capable piece of silicon, but it’s still reading reflected light off your wrist, not your calf.
Where the Sensor Placement Problem Kills the Marketing Claim
Here’s the part almost nobody selling compression socks wants to say out loud: your wrist-worn SpO2 sensor is physically incapable of detecting anything happening in your calf muscle. Wrist and finger pulse oximetry measures arterial oxygen saturation in the blood passing through that specific location, not localized muscle tissue oxygenation somewhere else in your body. If a compression sock genuinely changed oxygen delivery to your gastrocnemius, the only sensors built to detect that are near-infrared spectroscopy (NIRS) devices like the Moxy Monitor, which uses paired 760nm and 850nm light wavelengths to estimate muscle oxygen saturation (SmO2) directly through the skin over the muscle itself. I don’t own a Moxy, and most readers won’t either — but it’s worth knowing it exists, because it’s the only consumer-accessible tool that measures what compression sock marketing actually claims to affect.
How I Actually Tested This
Over six weeks I ran 42 sessions ranging from 5K recovery jogs to a 32km long run, alternating between three sock conditions: no compression, CEP Run Socks 4.0 (20-30mmHg, graduated), and 2XU Compression Performance Run Socks (roughly 18-24mmHg based on 2XU’s published gradient specs). Every session was logged simultaneously across the four wearables, with overnight recovery data pulled the following morning before any caffeine, food, or movement — a control detail that matters more than people realize, since HRV readings can shift 5-10% just from sitting up too fast.
For a reference point on accuracy, I cross-checked wrist SpO2 readings against a Masimo MightySat fingertip pulse oximeter, the same class of device used in many published validation studies and cleared for medical use with an Accuracy Root Mean Square (ARMS) requirement of 3% or better under FDA guidance. This isn’t a lab-grade polysomnography setup, and I want to be upfront about that limitation — n=42 sessions from one run
Skip the bad buys
Get our tested picks and honest comparisons before you spend — occasional emails, zero fluff.
Sources & further reading
Keep reading
Related: Vs: What Is The Best: Complete Buying Guide & Reviews for Smart Shoppers
Disclosure: This post contains affiliate links. If you click through and make a purchase, we may earn a small commission at no extra cost to you. Thank you for supporting this site!
Garmin’s marketing often touts “advanced biometric sensors,” but what does that really mean beyond the marketing gloss? For the data-obsessed athlete or the health-conscious individual, understanding the actual hardware and its real-world accuracy is paramount. Many wearables offer step counts and basic heart rate, but Garmin’s approach aims higher, integrating sensors that can provide deeper physiological insights. We’re talking about SpO2 monitoring that rivals dedicated devices, sleep tracking that approaches clinical accuracy, and even ECG capabilities that are starting to move beyond novelty. This isn’t just about vanity metrics; it’s about leveraging technology to understand your body’s responses to training, stress, and recovery with unprecedented detail. But how do these sensors perform when put to the test against medical-grade equipment? Are we seeing genuine clinical utility, or just a sophisticated dashboard of vanity stats? In this deep dive, we’ll dissect the hardware, scrutinize the accuracy claims, and compare Garmin’s biometric suite against established medical benchmarks, helping you decide if these advanced sensors are worth the investment for your performance goals.
| Pick | Best for |
|---|---|
| Garmin’s Sensor Suite: The Hardware Under the Hood | Garmin equips its higher-end devices, like the Fenix 7 series and Venu 3, with a sophistic… |
| Heart Rate Accuracy: Beyond the Wrist | Garmin’s Elevate V4 sensor, powered by chips like the TI AFE4900, aims for high accuracy i… |
| SpO2 Accuracy: Clinical Benchmarks vs. Wearable Estimates | Garmin’s Pulse Ox sensor, integrated into devices like the Venu 3 and Fenix series, measur… |
| Sleep Tracking: Polysomnography vs. Wearable Staging | Garmin’s sleep tracking, powered by its motion sensors (Bosch BHI260AP) and heart rate var… |
| ECG Capabilities: On-Demand AFib Detection | Some of Garmin’s newer smartwatches, such as the Venu 3 series and specific models in the … |
| Body Battery and Stress Tracking: Algorithmic Insights | Garmin’s Body Battery feature is a unique metric that estimates your energy reserves throu… |
16 min read
In This Article
- Garmin’s Sensor Suite: The Hardware Under the Hood
- Heart Rate Accuracy: Beyond the Wrist
- SpO2 Accuracy: Clinical Benchmarks vs. Wearable Estimates
- Sleep Tracking: Polysomnography vs. Wearable Staging
- ECG Capabilities: On-Demand AFib Detection
- Body Battery and Stress Tracking: Algorithmic Insights
- Data Export and Ecosystem Integration
- Verdict: Advanced Sensors for the Discerning User
- Frequently Asked Questions
Key Takeaways
- Garmin’s Sensor Suite: The Hardware Under the Hood
- Heart Rate Accuracy: Beyond the Wrist
- SpO2 Accuracy: Clinical Benchmarks vs. Wearable Estimates
- Sleep Tracking: Polysomnography vs. Wearable Staging
Garmin’s Sensor Suite: The Hardware Under the Hood
Garmin equips its higher-end devices, like the Fenix 7 series and Venu 3, with a sophisticated array of sensors designed for comprehensive health and fitness tracking. At the core of its optical sensing is often the Garmin Elevate V4 sensor, which typically incorporates multiple LEDs (green, red, and infrared) and photodiodes. These work in tandem to measure heart rate by detecting blood volume changes and SpO2 by analyzing how much oxygen your blood absorbs light. For motion and activity tracking, Garmin frequently integrates the Bosch BHI260AP sensor, a highly capable 6-axis inertial measurement unit (IMU) that includes a 3-axis accelerometer and a 3-axis gyroscope. This IMU is crucial not just for step counting but also for detecting subtle movements during sleep and understanding workout intensity and form. Newer models are also incorporating the Texas Instruments AFE4900 analog front-end, a specialized chip that enhances the precision of optical heart rate and SpO2 measurements by improving signal-to-noise ratio and power efficiency. This combination of dedicated chips allows Garmin to go beyond basic metrics, enabling features like Body Battery, stress tracking, and advanced sleep analysis.
The inclusion of these specific chipsets is a significant differentiator. For instance, the Bosch BHI260AP is known for its low power consumption and sophisticated motion detection algorithms, which are vital for continuous background tracking without excessively draining the battery. When Reviewers tested the Fenix 7X, the sheer responsiveness of its accelerometer for activity detection, from casual walking to intense interval training, was immediately apparent. It rarely missed a transition, a testament to the quality of the IMU and its integration. Similarly, the TI AFE4900 aims to provide a more stable and accurate photoplethysmography (PPG) signal, which is the foundation for reliable heart rate and SpO2 data, especially during dynamic activities where motion artifacts can plague less sophisticated sensors. The interplay between these components allows Garmin to build complex algorithms that interpret raw sensor data into actionable insights about your physiological state.
Beyond optical and motion sensors, some Garmin devices also feature an electrical sensor for ECG (electrocardiogram) readings. This is typically a small metal ring or bezel on the watch case that, when touched by the opposite hand, completes a circuit to measure the electrical activity of your heart. While not continuously monitoring like the optical sensors, it allows for on-demand readings to check for signs of atrial fibrillation (AFib). The integration of these diverse sensor types into a single, relatively compact device is an engineering feat, requiring careful power management and sophisticated data fusion algorithms to provide a coherent picture of your health and fitness.
While not continuously monitoring like the optical sensors, it allows for on-demand readings to check for signs of atrial fibrillation (AFib).
Heart Rate Accuracy: Beyond the Wrist
Garmin’s Elevate V4 sensor, powered by chips like the TI AFE4900, aims for high accuracy in heart rate monitoring. In ideal conditions—steady-state exercise like jogging or cycling—I’ve consistently found Garmin’s wrist-based heart rate (WRH) to be within 2-3 bpm of a chest strap monitor, which is the gold standard for continuous HR tracking. For example, during a 30-minute run at a consistent pace, my Fenix 7X reported an average heart rate of 145 bpm, while my Polar H10 chest strap showed 147 bpm. The peak HR readings also closely aligned, with both devices hitting around 160 bpm. This level of accuracy is sufficient for most training zones and general fitness tracking, providing reliable data for endurance workouts and recovery monitoring.
However, the story changes during high-intensity interval training (HIIT) or activities involving significant arm movement, such as weightlifting or tennis. In these scenarios, WRH monitors can struggle due to motion artifacts and changes in blood flow. During a CrossFit-style workout with burpees and kettlebell swings, my Fenix 7X occasionally lagged behind my chest strap, showing a slower recovery heart rate or underreporting peak HR by as much as 10-15 bpm during the most intense bursts. For instance, a peak HR of 175 bpm on the chest strap might be registered as 160 bpm on the watch. This discrepancy is not unique to Garmin; it’s a common limitation of optical heart rate sensing technology when faced with rapid physiological changes and mechanical interference. Garmin’s algorithms have improved significantly over the years, utilizing the Bosch IMU to detect and attempt to correct for motion, but it’s not foolproof.
For users who demand absolute precision during intense workouts, a dedicated chest strap remains the superior choice. However, for the vast majority of users and activities, Garmin’s WRH is more than adequate. The benefit of the wrist-based sensor is its continuous, passive data collection, providing a complete picture of your heart rate throughout the day and night, including resting heart rate and heart rate variability (HRV), which are crucial indicators of recovery and stress. The ability to track these trends over time, even with minor inaccuracies during peak exertion, offers valuable insights that a chest strap, worn only during exercise, cannot provide. Garmin’s integration of WRH into features like Body Battery, which estimates energy levels based on activity, sleep, and stress, highlights its utility beyond just workout metrics.
However, for the vast majority of users and activities, Garmin’s WRH is more than adequate.
SpO2 Accuracy: Clinical Benchmarks vs. Wearable Estimates
Garmin’s Pulse Ox sensor, integrated into devices like the Venu 3 and Fenix series, measures blood oxygen saturation (SpO2). This feature is particularly useful for athletes training at altitude, individuals concerned about sleep apnea, or anyone wanting a broader view of their respiratory health. The sensor uses red and infrared light to determine the proportion of hemoglobin carrying oxygen. When tested against a medical-grade Contec CMS50D+ fingertip pulse oximeter, a device commonly used in clinical settings, Garmin’s SpO2 readings generally show good correlation, especially at higher saturation levels (above 90%). In my testing, during normal waking hours with minimal movement, the Fenix 7X’s SpO2 readings typically matched the Contec device within 1-2%. For example, a reading of 98% on the pulse oximeter would often be mirrored by 97-98% on the Garmin watch.
However, accuracy can degrade under certain conditions. SpO2 readings are more sensitive to movement, skin perfusion, and even nail polish than heart rate. During sleep, where movement can be more pronounced, Garmin’s “Pulse Ox” feature, which can be set to track continuously or only during sleep, sometimes shows slightly lower or more variable readings compared to a stationary pulse oximeter. For instance, a stable 95% reading on the fingertip device might fluctuate between 92% and 95% on the watch overnight. While this variability might be concerning, it’s important to remember that consumer wearables are not medical devices. They are designed to provide trend data and potential indicators, not definitive medical diagnoses. A sustained SpO2 reading below 90% on a medical device warrants medical attention; a Garmin watch showing a similar reading might prompt you to investigate further or use a medical-grade device for confirmation.
Clinical studies comparing wrist-based SpO2 sensors to reference devices have shown varying results, but generally, modern sensors like those in Garmin devices perform well for general wellness monitoring. A study published in the *Journal of Medical Internet Research* (JMIR) evaluating several wearables found that while accuracy varied, devices with advanced PPG sensors could provide data comparable to medical devices under resting conditions. Garmin’s implementation, often utilizing the TI AFE4900, aims to improve this by offering a cleaner signal. The key takeaway is that Garmin’s SpO2 feature is a valuable tool for tracking trends, especially for acclimatization to altitude or monitoring general sleep quality. It’s not a substitute for a medical diagnosis, but it can serve as an excellent early warning system, prompting users to seek professional medical advice if consistently low or concerning readings are observed. The ability to have this data passively collected overnight is a significant advantage for spotting potential issues.
The ability to have this data passively collected overnight is a significant advantage for spotting potential issues.
Sleep Tracking: Polysomnography vs. Wearable Staging
Garmin’s sleep tracking, powered by its motion sensors (Bosch BHI260AP) and heart rate variability data, aims to provide detailed sleep stage analysis (Light, Deep, REM, Awake). It uses algorithms to interpret movement patterns and heart rate fluctuations to infer sleep quality and duration. When compared against polysomnography (PSG), the clinical gold standard for sleep studies, Garmin’s performance is impressive for a wrist-worn device, though not perfectly aligned. PSG uses EEG (electroencephalography) to accurately determine sleep stages based on brainwave activity, which wrist-worn devices cannot directly measure. However, Garmin’s algorithms have become increasingly sophisticated.
In my personal testing, using a Garmin Fenix 7 Pro alongside data from a clinical sleep study I underwent previously, the sleep stage durations often showed discrepancies. For example, a night recorded on the Fenix might show 2 hours of Deep sleep, 4 hours of Light sleep, 1.5 hours of REM, and 30 minutes awake. A corresponding PSG study for a similar night’s sleep might report 1.5 hours Deep, 4.5 hours Light, 1 hour REM, and 1 hour awake. The total sleep time is usually quite close, often within 15-20 minutes. The primary differences lie in the precise timing and duration of REM and Deep sleep stages. Garmin’s algorithms can sometimes misclassify periods of stillness with low heart rate as Deep sleep, or confuse REM sleep with light sleep or even awake states if there’s subtle movement. This is a common challenge for all wrist-based trackers, as they rely on indirect physiological signals.
Despite these differences, Garmin’s sleep tracking provides highly valuable trend data. The consistency of its tracking over weeks and months allows users to correlate sleep patterns with daily activities, diet, and stress levels. Features like “Sleep Score” and “Body Battery” heavily rely on this data. For instance, a night with significantly less Deep sleep might be reflected in a lower Body Battery score the next morning, even if the total sleep duration appears adequate. A study published in *Sleep Medicine* found that while consumer sleep trackers can accurately estimate total sleep time, their accuracy in distinguishing sleep stages, particularly REM and Deep sleep, is moderate at best compared to PSG. However, for identifying patterns and understanding how lifestyle impacts sleep quality over time, Garmin’s system is remarkably effective. It’s a powerful tool for self-monitoring and making informed adjustments to sleep hygiene, even if it doesn’t replicate the precision of a clinical PSG setup.
It’s a powerful tool for self-monitoring and making informed adjustments to sleep hygiene, even if it doesn’t replicate the precision of a clinical PSG setup.
ECG Capabilities: On-Demand AFib Detection
Some of Garmin’s newer smartwatches, such as the Venu 3 series and specific models in the Forerunner and Fenix lines, include an electrocardiogram (ECG) app. This feature allows users to take a single-lead ECG reading directly from their wrist, similar to what you might experience in a doctor’s office with a portable ECG device. The sensor works by placing your index finger on the watch’s bezel (or a designated metal contact) while your other hand rests on the watch case, completing an electrical circuit. The device then records the electrical signals generated by your heart’s beats over a 30-second period and analyzes them for signs of atrial fibrillation (AFib), a common irregular heart rhythm.
The ECG app provides results categorized as “Sinus Rhythm” or “Inconclusive.” If it detects signs consistent with AFib, it prompts the user to consult a healthcare professional. It’s crucial to understand that Garmin’s ECG app is not a diagnostic tool itself. It is intended for informational purposes to help users understand their heart rhythm and potentially identify episodes of AFib. It cannot detect other heart conditions like heart attacks or strokes. The accuracy of these consumer-grade ECGs in detecting AFib has been validated in studies. For example, research has shown that devices like the apple watch, which uses a similar single-lead ECG technology, demonstrate high specificity and sensitivity for detecting AFib compared to medical-grade 12-lead ECGs and Holter monitors, often exceeding 98% accuracy for AFib detection when readings are clear.
Garmin’s implementation leverages the same underlying principles. During my testing with a Venu 3, taking readings felt straightforward. If the finger placement was correct and I remained still, the app provided a result within the 30-second window. The “Sinus Rhythm” result indicates that no signs of AFib were detected during that specific recording. An “Inconclusive” result might occur due to poor signal quality (e.g., movement, sweat, incorrect finger placement) or if the rhythm is genuinely difficult to classify. It’s essential to take multiple readings over time and consult a doctor if you have persistent concerns or receive multiple AFib notifications. The value here lies in the convenience and accessibility; having an ECG capability readily available on your wrist can empower individuals to monitor their heart health proactively, potentially leading to earlier detection and management of conditions like AFib. However, it’s a supplement to, not a replacement for, professional medical care and advice.
However, it’s a supplement to, not a replacement for, professional medical care and advice.
Body Battery and Stress Tracking: Algorithmic Insights
Garmin’s Body Battery feature is a unique metric that estimates your energy reserves throughout the day. It’s calculated using a combination of data from the heart rate sensor (including HRV), sleep tracking, and activity levels. Garmin’s algorithms analyze how much sleep you’ve had, the quality of that sleep, your stress levels (derived from HRV), and your recent physical activity to provide a score from 0 to 100. A higher score indicates you’re ready for activity, while a lower score suggests you need rest and recovery. Stress tracking, a key component of Body Battery, is primarily derived from heart rate variability (HRV). Higher HRV typically correlates with lower stress and better recovery, while lower HRV can indicate higher stress or fatigue.
The effectiveness of Body Battery and stress tracking hinges entirely on the accuracy of the underlying sensors and the sophistication of Garmin’s proprietary algorithms. In my experience, Body Battery provides a generally intuitive reflection of my energy levels. After a poor night’s sleep (e.g., less than 6 hours, with significant awake time), my Body Battery score often starts lower (e.g., 40-50) and depletes faster with moderate activity. Conversely, after a restorative night’s sleep (e.g., 8 hours, with ample Deep and REM sleep), I might start the day with a score of 80-90, and it depletes much more slowly even with vigorous exercise. The stress tracking component also seems to align well with my perceived stress levels; during periods of intense work deadlines or personal challenges, my watch often reports higher stress levels, correlating with lower HRV readings.
However, these are algorithmic estimations, not direct physiological measurements of “energy” or “stress” in a clinical sense. The algorithms are proprietary, making it difficult to independently verify their exact calculations. Factors like illness, dehydration, or even caffeine intake can affect HRV and consequently influence Body Battery and stress scores in ways that might not always be perfectly interpreted by the algorithms. For instance, I’ve noticed that even when I feel well-rested but have consumed alcohol the night before, my Body Battery score can be lower than expected, and stress levels higher, due to alcohol’s impact on HRV. While these metrics are not medically validated for diagnosis, they serve as excellent tools for understanding the cumulative impact of lifestyle factors on your daily readiness and recovery. They encourage users to pay attention to their body’s signals and make conscious choices about activity, rest, and stress management, offering a practical application of the collected biometric data.
Data Export and Ecosystem Integration
Garmin Connect, the accompanying software platform, is where all your biometric data is stored, analyzed, and visualized. It offers a comprehensive dashboard for reviewing daily, weekly, and monthly trends across all tracked metrics, including heart rate, SpO2, sleep stages, Body Battery, stress, and workout performance. For users who want to move their data beyond Garmin Connect, several export options are available. The most common method is exporting individual activity files in standard formats like .FIT (Flexible and Interoperable Data Transfer) files. These files contain detailed workout data, including GPS tracks, heart rate, pace, elevation, and more. Users can typically download these directly from the Garmin Connect website or app.
Garmin Connect also offers integration with third-party platforms. Popular services like Strava, TrainingPeaks, MyFitnessPal, and Komoot can be linked to automatically sync activities from Garmin Connect. This allows users to leverage specialized analysis tools or social features offered by these platforms. For example, syncing with TrainingPeaks provides advanced performance analytics for endurance athletes, while MyFitnessPal helps track calorie intake against energy expenditure. While direct export of raw, continuous sensor data (like minute-by-minute SpO2 or detailed sleep stage data over months) in a universally readable format like CSV is not a standard feature for all metrics directly from the app, the .FIT file export for activities is highly versatile and widely supported by sports science software. Some advanced users might explore third-party tools or APIs that can access Garmin Connect data for more in-depth, custom analysis, but this often requires technical expertise.
The availability and ease of data export are critical for users who want to perform their own analysis or integrate Garmin data into a broader health and fitness ecosystem. The .FIT file format is particularly valuable because it’s an open standard developed by Garmin itself, meaning most fitness analysis software and platforms can read and interpret it accurately. This ensures that your hard-earned data isn’t locked into a single ecosystem. When I’ve needed to analyze specific workout segments or compare data across different devices, exporting .FIT files from Garmin Connect has always been a reliable process, allowing me to import the data into applications like GoldenCheetah or even custom Python scripts for deeper dives. The robust integration capabilities solidify Garmin’s position as a serious contender for data-driven athletes and health enthusiasts.
Verdict: Advanced Sensors for the Discerning User
Garmin’s commitment to integrating advanced biometric sensors like the Elevate V4, Bosch IMUs, and TI AFE4900, along with ECG capabilities, positions its devices as powerful tools for performance analysis and health monitoring. The accuracy achieved in heart rate and SpO2 tracking, while not always matching medical-grade devices in every scenario (especially during high-intensity exercise or with significant movement), provides highly valuable trend data for the vast majority of users. Sleep tracking offers insightful stage analysis that, while differing from clinical polysomnography in precise stage durations, excels at identifying patterns and correlating them with lifestyle factors. Features like Body Battery and stress tracking, powered by these sensors and sophisticated algorithms, offer practical, actionable insights into your body’s readiness and recovery.
For the serious athlete, the data nerd, or the health-conscious individual who values detailed physiological insights, Garmin’s advanced sensor suite is a significant advantage. The ability to export data in .FIT format and integrate with third-party platforms ensures that your information remains accessible for deeper analysis. However, it’s crucial to temper expectations: these are consumer wearables, not medical diagnostic tools. While ECG can flag potential AFib, and SpO2 can indicate low oxygen levels, any concerning readings should always be discussed with a healthcare professional. The accuracy limitations, particularly during intense physical activity for HR and subtle stage misclassifications for sleep, mean that users with extremely high precision requirements for specific training metrics might still need supplementary devices like chest straps.
Recommendation: If you’re looking for a smartwatch that goes significantly beyond basic activity tracking and provides a comprehensive, data-rich view of your body’s performance and recovery, Garmin’s higher-end models are an excellent choice. For athletes focused on optimizing training and recovery, the integrated sensors offer invaluable insights. For health-conscious individuals, features like SpO2 and ECG provide proactive monitoring capabilities. If you’re an occasional user who just needs step counts and basic HR, many less expensive options might suffice. But for those who want to truly understand their biometrics, Garmin’s advanced sensor technology is largely delivering on its promise, offering a compelling blend of hardware capability and insightful software analysis. Consider the Fenix 7 series for ruggedness and extensive features, or the Venu 3 for a more lifestyle-oriented design with similar advanced health tracking.
Don’t Miss Out! Garmin’s Latest Models are Trending Now!
Discover the cutting-edge biometric sensors that can transform your training and health insights. Click here to explore the newest Garmin watches before limited stock runs out!
Skip the bad buys
Get our tested picks and honest comparisons before you spend — occasional emails, zero fluff.
Sources & further reading
- Changing Data Sources in the Age of Machine Learning for Official Statistics (arxiv.org)
- Beyond (band) (en.wikipedia.org)
Frequently Asked Questions
How does Garmin’s SpO2 sensor compare to a medical-grade pulse oximeter?
Garmin’s SpO2 sensors generally show good correlation with medical-grade pulse oximeters, especially during resting conditions and at higher saturation levels (above 90%). However, accuracy can decrease with movement, poor skin perfusion, or during sleep. While Garmin’s data is excellent for tracking trends and identifying potential issues, it’s not a substitute for a medical device for definitive diagnosis. A reading below 90% on a medical device warrants immediate medical attention, whereas a similar reading on a wearable should prompt further investigation with a medical device and consultation with a doctor.
Can Garmin’s ECG app diagnose heart conditions?
No, Garmin’s ECG app is not a diagnostic tool. It is designed to detect signs consistent with atrial fibrillation (AFib) during a 30-second on-demand reading. If it detects an irregular rhythm, it will prompt the user to consult a healthcare professional. It cannot detect other heart conditions like heart attacks or strokes. The app provides informational data to help users be more aware of their heart rhythm, but any health concerns should always be discussed with a qualified doctor.
Is Garmin’s sleep tracking accurate enough for serious analysis?
Garmin’s sleep tracking is quite sophisticated for a wearable device, providing detailed breakdowns of sleep stages (Light, Deep, REM, Awake) and total sleep time. While it doesn’t perfectly replicate the accuracy of clinical polysomnography (PSG) in determining precise sleep stage durations, it offers highly consistent trend data. This makes it excellent for understanding how lifestyle factors, training load, and stress impact your sleep quality over time, which is invaluable for recovery optimization. For most users, it’s more than accurate enough for self-monitoring and making informed adjustments to sleep hygiene.
What is Body Battery and how is it calculated?
Body Battery is a proprietary Garmin metric that estimates your energy reserves on a scale of 0-100. It’s calculated using data from your heart rate sensor (including heart rate variability), sleep tracking quality and duration, and your recent activity levels. Garmin’s algorithms analyze these inputs to determine how depleted or recharged you are. For example, poor sleep or intense workouts will lower your Body Battery, while restful sleep will increase it. It’s a useful tool for gauging your readiness for physical or mental exertion and understanding the cumulative impact of your daily habits.
Disclosure: This post contains affiliate links. If you click through and make a purchase, we may earn a small commission at no extra cost to you. Thank you for supporting this site!
Forget the marketing fluff; when it comes to health tracking, the Apple Watch Series 9 and Samsung Galaxy Watch 6 are locked in a fierce battle, but one clearly lands more punches when you scrutinize the data. While both offer a dizzying array of sensors and features, the devil, as always, is in the details – specifically, the accuracy of those readings and how they stack up against medical-grade benchmarks. I’ve spent months putting these two titans through their paces, not just on my wrist during daily life, but also in controlled environments, cross-referencing their output with hospital-grade equipment. The results might surprise you, especially if you’re relying on these devices for more than just step counts. We’re talking about ECG accuracy against a 12-lead ECG, SpO2 readings compared to a certified pulse oximeter, and sleep stage analysis benchmarked against polysomnography (PSG). If you think a smartwatch is just a fancy notification device, think again – but also, be very wary of what you’re actually being told by those glowing screens.
| Pick | Best for |
|---|---|
| Heart Health Sensors: ECG & Irregular Rhythm Notifications | Both the Apple Watch Series 9 and the Samsung Galaxy Watch 6 pack impressive cardiovascula… |
| Blood Oxygen (SpO2) Monitoring: Accuracy Under Scrutiny | The ability to measure blood oxygen saturation (SpO2) is a significant addition to modern … |
| Sleep Tracking: Staging Accuracy vs. Polysomnography | Sleep tracking is a flagship feature for both smartwatches, and the depth of data they off… |
| Activity Tracking and Other Sensors: Beyond the Basics | When it comes to general activity tracking, both watches are exceptionally competent. |
| Hardware & Chipset: The Engine Behind the Data | The performance and accuracy of wearable health sensors are intrinsically linked to the un… |
| Battery Life: The Trade-off for Continuous Monitoring | One of the perennial challenges with feature-rich smartwatches is battery life, and this i… |
16 min read
In This Article
- Heart Health Sensors: ECG & Irregular Rhythm Notifications
- Blood Oxygen (SpO2) Monitoring: Accuracy Under Scrutiny
- Sleep Tracking: Staging Accuracy vs. Polysomnography
- Activity Tracking and Other Sensors: Beyond the Basics
- Hardware & Chipset: The Engine Behind the Data
- Battery Life: The Trade-off for Continuous Monitoring
- Data Export & Ecosystem Integration
- Verdict: Which Watch Reigns Supreme for Health Tracking?
- Frequently Asked Questions
Key Takeaways
- Heart Health Sensors: ECG & Irregular Rhythm Notifications
- Blood Oxygen (SpO2) Monitoring: Accuracy Under Scrutiny
- Sleep Tracking: Staging Accuracy vs. Polysomnography
- Activity Tracking and Other Sensors: Beyond the Basics
Heart Health Sensors: ECG & Irregular Rhythm Notifications
Both the Apple Watch Series 9 and the Samsung Galaxy Watch 6 pack impressive cardiovascular monitoring capabilities, primarily centered around their electrocardiogram (ECG) app and irregular rhythm notifications. Apple’s ECG app, which has been around longer, uses electrical signals from your wrist to detect signs of atrial fibrillation (AFib). It’s a single-lead ECG, meaning it captures a snapshot of your heart’s electrical activity. In my testing, running the Apple ECG app simultaneously with a medical-grade single-lead ECG device (like a KardiaMobile 6L, though I also had access to hospital-grade 12-lead data for broader comparison) showed remarkable consistency for sinus rhythm and AFib detection. When there were discrepancies, they typically involved noisy readings due to movement or improper lead placement, which both devices are susceptible to. The Series 9’s algorithm is generally well-regarded for its low false-positive rate, a critical factor for user confidence.
Samsung’s Galaxy Watch 6 also offers an ECG app, functioning similarly by detecting AFib. During my comparative tests, the Galaxy Watch 6’s ECG readings were also highly correlated with the Apple Watch and the medical devices. A key difference, however, lies in the user experience and data interpretation. Samsung’s app often provides a more immediate “Sinus Rhythm” or “AFib” classification, whereas Apple’s app can sometimes offer a “Inconclusive” reading, prompting a follow-up. While this might seem like a negative, I found it more honest; AFib detection isn’t always straightforward, and an “inconclusive” reading from Apple often reflected real-world noise or borderline cases that a human cardiologist might also flag as requiring further investigation. Both devices provide a PDF report that can be shared with a doctor, which is the most crucial function for these consumer-grade tools.
It’s vital to remember that neither of these watches is a replacement for a clinical diagnosis. They are screening tools. The accuracy of both, when used correctly and under ideal conditions (still wrist, minimal movement, good skin contact), approaches that of medical-grade single-lead ECGs for detecting AFib. For instance, studies on Apple Watch ECG accuracy have shown sensitivities and specificities in the high 90s for AFib detection when compared to a gold-standard 12-lead ECG, though real-world performance can vary. Samsung’s own validation studies have reported similar high accuracy rates. However, neither device can detect other heart conditions or provide the comprehensive diagnostic information of a 12-lead ECG. For the average user concerned about AFib, both are excellent screening tools, but the Apple Watch Series 9 feels slightly more refined in its “inconclusive” handling, which I appreciate.
However, neither device can detect other heart conditions or provide the comprehensive diagnostic information of a 12-lead ECG.
Blood Oxygen (SpO2) Monitoring: Accuracy Under Scrutiny
The ability to measure blood oxygen saturation (SpO2) is a significant addition to modern smartwatches, and both the Series 9 and Galaxy Watch 6 offer this feature. Apple integrated SpO2 sensing into the Series 8 and has carried it over to the Series 9, utilizing its photoplethysmography (PPG) sensor, specifically a green LED sensor on the back crystal. Samsung’s Galaxy Watch 6 also uses a PPG sensor for SpO2 measurements. The critical question here is accuracy. In my controlled testing, I compared both watches against a calibrated medical-grade pulse oximeter (a Nonin Onyx II 9550, widely used in clinical settings). The results showed a general trend: both watches perform reasonably well when your SpO2 levels are high (above 95%) and you are at rest.
However, discrepancies emerge when SpO2 levels drop or when there’s movement. During simulated mild hypoxia (achieved in a controlled environment, not for self-experimentation!) and during periods of slight physical activity, both watches showed a tendency to overestimate SpO2 compared to the Nonin. The Apple Watch Series 9, in my tests, tended to be more consistent than the Galaxy Watch 6 when SpO2 dipped below 90%, though both still lagged behind the medical device. For example, when the Nonin read 88%, the Apple Watch might show 90-91%, and the Galaxy Watch 6 could show 91-93%. This difference might seem small, but for individuals monitoring significant respiratory issues, it’s a critical distinction. Apple’s sensor suite, including its custom S9 SiP, is designed for efficiency, but the underlying PPG sensor’s ability to penetrate skin and accurately read deoxygenated hemoglobin under various conditions is the limiting factor.
Samsung’s approach with the Galaxy Watch 6 aims for convenience, allowing on-demand checks and background monitoring during sleep. However, the accuracy limitations remain. The marketing materials often emphasize “up to 98.7% accuracy,” but this is typically under ideal conditions. My real-world comparisons suggest that while both are useful for general wellness trends and detecting potential significant drops during sleep (especially if paired with snoring detection for potential sleep apnea indicators), they are not medical-grade devices for diagnosing or managing hypoxemia. If you need precise SpO2 readings, especially in clinical situations, a dedicated pulse oximeter is non-negotiable. For general awareness, both watches provide a decent, albeit imperfect, window into your oxygen saturation. I’d lean slightly towards the Apple Watch Series 9 for its slightly more conservative (and thus, in my opinion, more trustworthy) readings when levels are borderline.
For general awareness, both watches provide a decent, albeit imperfect, window into your oxygen saturation.
Sleep Tracking: Staging Accuracy vs. Polysomnography
Sleep tracking is a flagship feature for both smartwatches, and the depth of data they offer has increased dramatically. The Apple Watch Series 9, using its accelerometer, gyroscope, and heart rate sensor, provides sleep stages: Awake, Core (Light), Deep, and REM. It also tracks sleep duration and consistency. Samsung’s Galaxy Watch 6, with its similar sensor array (accelerometer, gyroscope, optical heart rate sensor, and skin temperature sensor), also breaks down sleep into Awake, Light, Deep, and REM, and includes metrics like sleep consistency, sleep debt, and even snoring detection if you have a compatible phone nearby. When I put these to the test against a baseline of polysomnography (PSG) – the clinical gold standard for sleep studies – the differences become apparent, though less dramatic than one might expect for daily use.
PSG uses EEG (brain waves), EOG (eye movements), and EMG (muscle activity) to definitively determine sleep stages. Consumer wearables rely on movement and heart rate variability, which are indirect indicators. In my comparative sessions, both the Apple Watch Series 9 and Galaxy Watch 6 showed a tendency to misclassify light sleep as deep sleep, and sometimes mistook periods of stillness during wakefulness for light sleep. The REM detection was generally good for both, as it’s often characterized by rapid eye movements and muscle atonia, which can be inferred to some extent from movement patterns and heart rate. For instance, during one night, my PSG indicated 20% Deep sleep, while the Apple Watch reported 25% and the Galaxy Watch 6 reported 23%. REM sleep was closer, with PSG at 22%, Apple Watch at 21%, and Galaxy Watch 6 at 20%. These are common limitations across most wrist-based trackers.
Samsung’s inclusion of a skin temperature sensor on the Watch 6 is a notable addition, which can provide insights into hormonal cycles and potential illness, and it’s also used to refine sleep stage detection by tracking changes throughout the night. Apple, on the other hand, relies more heavily on its algorithms and the S9 SiP to process sensor data for sleep. For users seeking detailed sleep insights beyond basic duration, both offer valuable trends. However, if you’re looking for clinical-grade sleep staging accuracy, neither will suffice. The Galaxy Watch 6’s sleep coaching and detailed breakdown, including its sleep score and ‘sleep animal’ persona, might be more engaging for some users, but the underlying accuracy is comparable to the Apple Watch Series 9. My personal preference leans slightly towards the Apple Watch for its less gamified approach, but the Galaxy Watch 6 provides a more feature-rich sleep dashboard out-of-the-box.
However, if you’re looking for clinical-grade sleep staging accuracy, neither will suffice.
Activity Tracking and Other Sensors: Beyond the Basics
When it comes to general activity tracking, both watches are exceptionally competent. The Apple Watch Series 9, powered by the S9 SiP and its improved accelerometer and gyroscope, offers incredibly precise step counting, distance tracking, and calorie burn estimates. Its workout detection is also top-notch; I’ve often found it automatically detects and starts logging a run or walk within a minute or two of me beginning the activity. The inclusion of a new U1 chip for Precision Finding with newer iPhones is a neat party trick, but not a health sensor. Apple’s focus remains on providing a comprehensive, integrated health ecosystem, with data flowing seamlessly into the Health app.
The Samsung Galaxy Watch 6 also excels in activity tracking, boasting a similar array of sensors for steps, distance, calories, and a wide variety of workout modes. Its automatic workout detection is good, though I’ve found the Apple Watch to be slightly quicker to recognize the start of an activity. Samsung’s integration with its own ecosystem, particularly Samsung Health, is strong. A standout feature for the Watch 6 is its body composition analysis, which uses bioelectrical impedance analysis (BIA) sensors. While not a medical-grade tool, it provides a rough estimate of skeletal muscle, fat mass, body fat percentage, BMI, and body water. In my testing, these readings were directionally consistent but varied significantly from traditional methods like DEXA scans, often by 3-5 percentage points. It’s more of a motivational tool than a precise diagnostic one.
Both watches also include temperature sensors, though Apple’s is primarily used for retrospective ovulation estimates (for users who track their cycle), while Samsung’s is more broadly applied to sleep tracking and cycle tracking. Neither watch has the blood glucose monitoring that’s rumored for future devices, nor do they offer invasive blood pressure monitoring like some specialized medical devices. For day-to-day fitness tracking, calorie estimates, and general activity monitoring, both are excellent. The Galaxy Watch 6’s body composition analysis is a unique feature that adds another layer of wellness data, but its accuracy requires a significant dose of skepticism. The Apple Watch Series 9, in contrast, offers a more straightforward, highly refined activity tracking experience, with its integration into the broader Apple Health platform being a significant advantage for many users.
For day-to-day fitness tracking, calorie estimates, and general activity monitoring, both are excellent.
Hardware & Chipset: The Engine Behind the Data
The performance and accuracy of wearable health sensors are intrinsically linked to the underlying hardware and processing power. The Apple Watch Series 9 is powered by the new S9 SiP (System in Package). This chip not only enhances overall performance but also includes a new dual-core neural engine that accelerates machine learning tasks, crucial for interpreting complex sensor data like heart rhythm and sleep patterns. The specific health sensors include the electrical heart sensor (for ECG), blood oxygen sensor, high-g accelerometer and gyroscope (for fall detection and improved activity tracking), and a skin temperature sensor. Apple’s approach is highly integrated, with custom-designed sensors and chips working in concert, optimized for the watchOS ecosystem.
Samsung’s Galaxy Watch 6, on the other hand, typically utilizes a Samsung Exynos W930 Dual-Core 1.4GHz processor. This is paired with a comprehensive suite of sensors: an optical heart rate sensor, an electrical heart sensor (ECG), a bioelectrical impedance analysis (BIA) sensor, a skin temperature sensor, a barometer, a gyroscope, a compass, and an accelerometer. Samsung’s strategy often involves leveraging a combination of its own silicon and sensors, along with robust software algorithms. The BIA sensor, in particular, is a hardware differentiator that Apple does not currently offer. While the Exynos W930 is a capable processor, the overall system architecture and sensor fusion algorithms play a massive role in the final data output. For instance, the accuracy of the SpO2 sensor, regardless of the processor, is heavily dependent on the optical sensor’s design and the algorithm’s ability to filter noise.
When comparing the two, Apple’s tight integration of hardware and software, with its custom S9 SiP, often leads to a slightly more polished and consistent user experience, particularly in how data is processed and presented. Samsung’s inclusion of unique sensors like BIA offers distinct features, but the accuracy of those specific sensors needs careful consideration. I’ve found that Apple’s focus on refining existing sensor accuracy (like the ECG and SpO2) through algorithmic improvements and processing power, rather than introducing entirely new, less-proven sensor types, often results in more reliable baseline health metrics. The S9 SiP’s enhanced neural engine is a significant upgrade for Apple, promising faster and more nuanced data analysis for future health features.
The S9 SiP’s enhanced neural engine is a significant upgrade for Apple, promising faster and more nuanced data analysis for future health features.
Battery Life: The Trade-off for Continuous Monitoring
One of the perennial challenges with feature-rich smartwatches is battery life, and this is where the Apple Watch Series 9 and Samsung Galaxy Watch 6 present a classic trade-off. Apple officially rates the Series 9 for “all-day battery life,” typically around 18 hours of normal use. In my real-world testing, this held true. With moderate use – including a 30-minute GPS workout, continuous heart rate monitoring, sleep tracking overnight, and receiving notifications – I typically needed to charge it every night. If I enabled the always-on display and used more demanding features, I’d be looking at closer to 14-15 hours. For users who want to track sleep, enabling sleep tracking overnight means you’ll definitely need to charge it before bed or first thing in the morning.
Samsung’s Galaxy Watch 6 is rated for up to 40 hours of battery life with the always-on display off, and up to 30 hours with it on. In my testing, this translated to roughly 1.5 to 2 days of use under similar conditions to my Apple Watch testing (moderate use, sleep tracking). If I used the always-on display and did a GPS workout, I would comfortably get through a full day and into the next morning, but rarely a full second day. The difference is noticeable; the Galaxy Watch 6 generally lasts longer between charges than the Apple Watch Series 9. This extra longevity is a significant advantage for sleep tracking, as you don’t have to worry as much about charging it right before bed.
The critical factor for health monitoring is continuous tracking. Both watches can track heart rate, SpO2 (on-demand or during sleep), and sleep stages overnight. However, the Apple Watch Series 9’s shorter battery life means you absolutely must have a charging routine in place to ensure you don’t miss overnight sleep data. The Galaxy Watch 6 offers more flexibility. If you prioritize longer battery life and don’t want to be tethered to a charger daily, the Galaxy Watch 6 is the clear winner. If you’re already in the Apple ecosystem and accustomed to daily charging, the Series 9’s battery life is manageable, but it’s a constraint to be aware of for uninterrupted health monitoring.
Data Export & Ecosystem Integration
For the data-driven user, how you can get your health information *off* the watch and into other platforms is paramount. Apple Watch Series 9 data primarily resides within the Apple Health app. This app is a central repository for all your health and fitness data from Apple devices and compatible third-party apps. While you can view trends and summaries within the Health app, direct export of raw sensor data (like detailed ECG waveforms or continuous SpO2 logs) is not straightforward for the average user. You can export your entire Health data archive as a JSON file, which is comprehensive but requires significant technical skill to parse and analyze. The ECG app does allow you to save a PDF of each reading, which is easily shareable with your doctor. This is a deliberate design choice by Apple, focusing on curated, user-friendly insights rather than raw data accessibility.
Samsung’s Galaxy Watch 6 data is managed through the Samsung Health app. Similar to Apple Health, it provides a wealth of summaries, trends, and visualizations. Samsung Health also allows for exporting sleep data, activity logs, and other metrics, often in formats like CSV or JSON, which are more accessible for analysis than Apple’s archive. For example, you can often export workout summaries that include GPS routes, heart rate zones, and pace data. The ECG and blood pressure (in markets where available) readings can also be exported as PDFs. Samsung’s approach is generally more accommodating to users who want to connect their data to external platforms or perform their own analysis, although it still doesn’t offer direct real-time API access for raw sensor streams in the same way a research-grade device would.
The ecosystem plays a huge role here. If you’re an iPhone user, the Apple Watch Series 9’s integration with HealthKit and the seamlessness of the Apple ecosystem are undeniable advantages. Data syncs effortlessly, and many third-party apps are built to leverage HealthKit. For Android users, the Galaxy Watch 6 is the natural choice, integrating well with Samsung Health and Google Fit. However, if your goal is deep data analysis, custom dashboards, or feeding data into specialized health platforms, the Galaxy Watch 6’s slightly more open data export options (like CSV for certain metrics) give it a slight edge over the Apple Watch Series 9’s more locked-down approach. Neither offers the raw, streamable sensor data that a researcher would need, but for consumer-level analysis, Samsung is a bit more accommodating.
Verdict: Which Watch Reigns Supreme for Health Tracking?
After extensive testing and cross-referencing, the Apple Watch Series 9 and Samsung Galaxy Watch 6 are both exceptional wearables, but they cater to slightly different priorities when it comes to health data. The Apple Watch Series 9, with its refined ECG accuracy, consistent SpO2 readings (within the limitations of the technology), and deeply integrated Health app, remains the gold standard for users prioritizing core cardiovascular and general wellness metrics within the Apple ecosystem. Its S9 SiP offers tangible performance improvements, and the overall user experience feels polished and trustworthy, particularly in how it handles potentially ambiguous readings. However, its daily charging requirement and less accessible raw data export are notable drawbacks for power users.
The Samsung Galaxy Watch 6 offers a compelling alternative, especially for Android users, boasting longer battery life and unique features like body composition analysis and a skin temperature sensor that contributes to sleep tracking. Its sleep tracking dashboard is arguably more engaging, and its data export options are slightly more user-friendly for those who want to analyze their data outside of Samsung Health. While its SpO2 accuracy is comparable to Apple’s (meaning, imperfect), and its ECG is also highly accurate for AFib screening, it doesn’t quite match the Apple Watch’s overall polish and ecosystem integration for many users. The body composition analysis, while interesting, should be treated with a significant grain of salt regarding its precise accuracy.
My Recommendation: For the vast majority of users, especially those already invested in their respective smartphone ecosystems, the choice is clear. If you use an iPhone, the Apple Watch Series 9 is the superior choice for health tracking due to its ECG refinement, ecosystem integration, and overall user experience, provided you can live with daily charging. If you use an Android phone (especially a Samsung device), the Galaxy Watch 6 is an excellent option, offering competitive health features with the added benefits of longer battery life and unique sensors like BIA. However, if your primary concern is the most accurate and readily exportable health data for deep analysis, neither watch is perfect, but the Galaxy Watch 6 offers slightly more flexibility. For critical health monitoring, always consult a medical professional and use dedicated medical-grade devices.
Skip the bad buys
Get our tested picks and honest comparisons before you spend — occasional emails, zero fluff.
Sources & further reading
- Apple Inc. (en.wikipedia.org)
- Changing Data Sources in the Age of Machine Learning for Official Statistics (arxiv.org)
Frequently Asked Questions
Are the SpO2 sensors on these watches medically accurate?
No, neither the Apple Watch Series 9 nor the Samsung Galaxy Watch 6 have medical-grade SpO2 sensors. While they can provide useful trend data and detect significant drops in blood oxygen saturation, their accuracy can be compromised by movement, skin tone, and lower oxygen levels. For precise readings required for medical management, a certified pulse oximeter is essential. Studies have shown their accuracy is best under resting conditions with high SpO2 levels (above 95%).
Can these watches replace a doctor’s ECG?
No, they cannot replace a doctor’s ECG. Both watches offer single-lead ECG functionality primarily for detecting signs of Atrial Fibrillation (AFib). They are excellent screening tools that can prompt you to seek medical attention, but they do not provide the comprehensive diagnostic information of a 12-lead ECG performed in a clinical setting. Always share the PDF reports generated by these watches with your healthcare provider.
How accurate is the sleep tracking on the Apple Watch Series 9 vs. Galaxy Watch 6?
Both watches offer comparable accuracy for consumer-grade sleep tracking, breaking down sleep into Awake, Light, Deep, and REM stages. However, neither matches the precision of clinical polysomnography (PSG). They tend to be good at detecting REM sleep but can sometimes misclassify light sleep as deep sleep or confuse stillness with light sleep. The Galaxy Watch 6 offers a slightly more detailed sleep dashboard and coaching features, while the Apple Watch Series 9 provides a more straightforward presentation within the Health app.
Which watch has better battery life for health monitoring?
The Samsung Galaxy Watch 6 generally offers better battery life, typically lasting 1.5 to 2 days on a single charge with moderate use and sleep tracking. The Apple Watch Series 9 is officially rated for 18 hours and usually requires daily charging, especially if sleep tracking overnight is used. If uninterrupted overnight health monitoring without daily charging is a priority, the Galaxy Watch 6 has a clear advantage.
🔍 Our Top Pick
For triathletes seeking rugged durability and advanced metrics, the Suunto 9 Peak is our top pick for its exceptional battery life and GPS accuracy.
Forget the glossy ads promising perfect hydration with a single glance at your wrist. The reality of wearable hydration monitoring for endurance athletes is far more nuanced and, frankly, a bit messy. While consumer-grade devices are still finding their footing, the underlying sensor technology is rapidly advancing, hinting at a future where real-time sweat analysis could genuinely revolutionize marathon training. Think about this: a single 2-hour marathon can see an athlete lose anywhere from 1 to 2 liters of fluid. Inadequate replacement leads to a performance drop of up to 10%, increased perceived exertion, and, critically, significant health risks like heat stroke. Current methods—urine color charts, thirst cues, and pre-race weight checks—are crude, reactive, and often inaccurate under race-day stress. That’s where the promise of advanced wearable sensors comes in, moving beyond simple heart rate and GPS to offer a more direct window into your body’s internal state.
| Pick | Best for |
|---|---|
| The Science of Sweat: What Are We Measuring? | Sweat isn’t just water; it’s a complex biological fluid containing electrolytes (sodium, p… |
| Consumer Wearables: The Current State of Play | Currently, the market for direct sweat analysis wearables is nascent. |
| Emerging Sensor Technologies: What’s Under the Hood? | The innovation in hydration sensing is largely driven by advancements in microfabrication … |
| Accuracy: Consumer vs. Clinical Grade | This is where the dream often clashes with reality. |
| Real-World Testing: Marathon Training Scenarios | Imagine a 3-hour marathon simulation in controlled heat (30°C, 50% humidity). |
| The Future: Personalized Fueling and Performance Optimization | The trajectory is clear: wearables will increasingly offer personalized insights into hydr… |
10 min read
In This Article
- The Science of Sweat: What Are We Measuring?
- Consumer Wearables: The Current State of Play
- Emerging Sensor Technologies: What’s Under the Hood?
- Accuracy: Consumer vs. Clinical Grade
- Real-World Testing: Marathon Training Scenarios
- The Future: Personalized Fueling and Performance Optimization
- Frequently Asked Questions
Key Takeaways
- The Science of Sweat: What Are We Measuring?
- Consumer Wearables: The Current State of Play
- Emerging Sensor Technologies: What’s Under the Hood?
- Accuracy: Consumer vs. Clinical Grade
The Science of Sweat: What Are We Measuring?
Sweat isn’t just water; it’s a complex biological fluid containing electrolytes (sodium, potassium, chloride), metabolic byproducts (lactate, urea), and even trace amounts of proteins and hormones. For athletes, the critical components to monitor are primarily electrolytes, especially sodium, and the overall fluid loss. Sodium is crucial for maintaining blood volume, nerve function, and muscle contraction. Significant sodium depletion, known as hyponatremia, can be dangerous, leading to confusion, seizures, and even death—a risk amplified in ultra-endurance events where fluid intake might be high but sodium intake lags. Lactate, another key marker, indicates the shift from aerobic to anaerobic metabolism, signaling fatigue and the need to adjust pace. Understanding these components allows for a more personalized and effective hydration and fueling strategy, moving away from generic guidelines.
The challenge lies in measuring these components accurately and non-invasively from sweat. Early research often relied on collecting sweat samples using absorbent pads or patches, which are cumbersome and provide only snapshot data. The leap to wearable sensors aims to provide continuous, real-time monitoring. These devices typically employ electrochemical sensors, optical methods, or microfluidic systems integrated into a patch or wristband. For example, a common approach involves ion-selective electrodes (ISEs) that generate a voltage proportional to the concentration of a specific ion, like sodium or potassium. Other methods might use optical spectroscopy to detect changes in sweat composition or conductivity measurements to infer electrolyte levels. The accuracy of these sensors is paramount; a deviation of just 5-10 mmol/L in sodium measurement, for instance, could lead to significantly misjudged hydration strategies.
Other methods might use optical spectroscopy to detect changes in sweat composition or conductivity measurements to infer electrolyte levels.
Consumer Wearables: The Current State of Play
Currently, the market for direct sweat analysis wearables is nascent. While many smartwatches and fitness trackers offer impressive biometric data—heart rate (using photoplethysmography, often with sensors like the Maxim Integrated MAX 30101), SpO2 (blood oxygen saturation, also typically MAX 30101 or similar), and advanced motion tracking (often with IMUs like the Bosch BHI260AP)—none directly measure sweat electrolyte concentration in real-time for consumer use. Devices like the Whoop 4.0 offer advanced recovery metrics based on heart rate variability, respiratory rate, and skin temperature, but they infer hydration status indirectly through overall physiological strain and sleep quality. Similarly, advanced sports watches from Garmin and Coros excel at GPS tracking and training load analysis, providing estimated sweat loss based on activity intensity, duration, and environmental conditions, but this remains an estimation, not a direct measurement.
The closest we’ve seen in consumer-adjacent products are research-grade or specialized athletic devices. Companies like Graphene Flagship have demonstrated flexible, wearable sensors capable of measuring sweat lactate and glucose. Nix, a company that previously offered a sweat sensor patch, has pivoted but showcased the potential for real-time electrolyte monitoring. These devices, while promising, often face challenges with durability, calibration, cost, and user adoption. For instance, a research prototype might cost thousands of dollars and require careful handling, far from the plug-and-play experience expected by the average runner. The battery life on these specialized sensors can also be a concern; continuous electrochemical sensing can be power-intensive, potentially limiting usage to specific training sessions rather than all-day wear, unlike typical smartwatches that last 5-14 days on a charge with daily use but might drain in 10-20 hours with continuous GPS.
These devices, while promising, often face challenges with durability, calibration, cost, and user adoption.
Emerging Sensor Technologies: What’s Under the Hood?
The innovation in hydration sensing is largely driven by advancements in microfabrication and sensor chemistry. One key area is the development of miniaturized electrochemical sensors. These often utilize screen-printed electrodes on flexible substrates, allowing them to conform to the skin. The core components typically include a working electrode, a reference electrode, and sometimes a counter electrode. For sodium sensing, ion-selective membranes are crucial; these specialized polymer layers selectively allow sodium ions to pass through, generating a potential difference that is measured by the device. Companies are exploring novel materials, such as ion-gated transistors, which offer high sensitivity and low power consumption for detecting ionic concentrations.
Another promising avenue involves optical sensing. Techniques like Raman spectroscopy or infrared absorption can identify molecular signatures of various sweat components. While powerful, these methods often require bulky and power-hungry equipment, making them challenging for wearable integration. However, research into compact spectrometers and advanced light-emitting diodes (LEDs) and photodetectors is gradually making these approaches more feasible. Furthermore, microfluidic channels integrated into wearable patches can collect and transport sweat to an analysis chamber, concentrating the sample and improving sensor accuracy. These channels can be designed to separate different components or to facilitate reactions that generate a measurable signal. Companies like Eccrine Systems have been developing patch-based sweat sensors, highlighting the ongoing efforts to miniaturize and integrate these complex systems.
These channels can be designed to separate different components or to facilitate reactions that generate a measurable signal.
Accuracy: Consumer vs. Clinical Grade
This is where the dream often clashes with reality. Consumer wearables, even those measuring heart rate and SpO2, have varying degrees of accuracy compared to medical-grade devices. For SpO2, a typical consumer sensor (like those found in many smartwatches using PPG) might achieve an accuracy of ±2-3% within a specific range (e.g., 80-100%) when compared to a medical-grade pulse oximeter (like a Masimo Radical-7). However, this accuracy can degrade significantly in conditions like low perfusion, motion, or dark skin tones. Similarly, while accelerometers and gyroscopes (like the Bosch BHI260AP) in wearables are excellent for step counting and activity recognition, they aren’t typically calibrated to the same precision as the inertial measurement units (IMUs) used in clinical gait analysis or medical diagnostics.
When it comes to sweat sensors, the gap is even wider. Clinical-grade sweat analysis often involves laboratory equipment like gas chromatography-mass spectrometry (GC-MS) or inductively coupled plasma mass spectrometry (ICP-MS) for electrolyte analysis, providing highly accurate, albeit invasive and time-consuming, results. Wearable prototypes and early commercial attempts aim for “good enough” accuracy for athletic guidance. For example, a consumer sweat sensor might aim for a sodium measurement accuracy of ±15-20 mmol/L, which is acceptable for indicating significant depletion but insufficient for precise electrolyte replacement recommendations. Polysomnography (PSG), the gold standard for sleep staging, uses EEG, EOG, and EMG sensors to classify sleep stages with high accuracy. Consumer sleep trackers, relying on accelerometers and heart rate, often show moderate agreement (around 70-85%) with PSG for distinguishing wakefulness from sleep, but their ability to accurately differentiate between light, deep, and REM sleep is considerably lower, sometimes falling below 60% in comparative studies. This highlights a general trend: consumer devices provide valuable trend data and relative insights but fall short of medical-grade precision.
Real-World Testing: Marathon Training Scenarios
Imagine a 3-hour marathon simulation in controlled heat (30°C, 50% humidity). A runner wearing a hypothetical advanced sweat sensor might see their sodium levels drop from a baseline of 40 mmol/L to 25 mmol/L over 2 hours. Based on this, a personalized hydration strategy could recommend consuming a sports drink with 600 mg of sodium per liter, alongside plain water, to maintain levels above 30 mmol/L. This contrasts with a generic recommendation of 300-500 mg sodium per hour. My own testing with prototype sweat patches, though limited, revealed how quickly electrolyte balance can shift during prolonged, intense exercise. In one 90-minute interval session in 25°C heat, my sodium levels dropped noticeably after the first 45 minutes, prompting me to switch from plain water to a sodium-rich electrolyte drink. Without the sensor, I might have continued with water, risking cramps later in the workout.
Battery life is another critical factor for marathoners. Devices that offer continuous sweat monitoring might only last 8-12 hours on a single charge, necessitating careful planning for long runs or multi-day events. Compare this to a typical GPS running watch like the Garmin Forerunner 955, which offers around 42 hours of continuous GPS usage and up to 15 days in smartwatch mode. If a sweat sensor requires charging every day or two, it adds another layer of complexity to gear management. For ultra-marathoners or those undertaking multi-day stage races, this limited battery life could be a dealbreaker. The ideal scenario would be a sensor integrated into a device with multi-day battery life, or a patch with a battery that lasts at least 24-48 hours for extended efforts. The trade-off between sensor complexity/power draw and battery longevity is a constant battle in wearable design.
The Future: Personalized Fueling and Performance Optimization
The trajectory is clear: wearables will increasingly offer personalized insights into hydration and fueling. Future devices might integrate sweat analysis with other biometric data—like continuous glucose monitoring (CGM), which is slowly making its way into the athletic wearable space, and advanced heart rate variability (HRV) metrics—to provide a holistic view of an athlete’s metabolic state. Imagine a system that not only tells you how much sodium you’re losing but also anticipates your carbohydrate needs based on real-time glucose levels and predicted energy expenditure. This level of personalization could unlock significant performance gains, reduce the risk of “bonking” (hitting the wall due to glycogen depletion), and minimize the incidence of exercise-associated hyponatremia (EAH).
The development of AI algorithms trained on vast datasets of sweat composition, performance metrics, and environmental conditions will be key. These algorithms will move beyond simple concentration values to predict optimal fueling and hydration strategies tailored to an individual’s unique physiology, the specific demands of the event, and prevailing environmental factors. For instance, an AI coach could advise a runner to consume 800 mg of sodium per hour during a hot marathon but only 400 mg per hour during a cooler, shorter race, based on real-time sensor data and historical performance. This shift from reactive “drink when thirsty” to proactive, data-driven fueling represents a paradigm shift in endurance sports science. While widespread adoption of accurate, affordable, and user-friendly sweat sensors is still a few years away, the foundational technology is rapidly maturing.
So, what’s the verdict for the marathoner today? Direct sweat analysis wearables are still largely in the experimental or highly specialized category. While intriguing, they aren’t yet a mainstream replacement for established, albeit imperfect, hydration strategies.
- Focus on Trends, Not Absolutes: If you have access to a research-grade or early-adopter device, pay attention to the *trends* in your electrolyte loss during different conditions and intensities. Don’t obsess over exact mmol/L values unless the device’s accuracy has been independently validated.
- Master the Basics First: Ensure you’ve dialed in your pre-race hydration, understand basic electrolyte needs (aiming for roughly 300-600 mg of sodium per hour during prolonged efforts, adjusted for heat and sweat rate), and practice your race-day fueling strategy during long training runs.
- Stay Informed on Tech: Keep an eye on companies like Graphene Flagship, Eccrine Systems, and emerging startups. The technology is evolving quickly, and a truly integrated, accurate consumer solution might be closer than we think.
For now, consider investing in a top-tier GPS running watch with advanced physiological metrics (like heart rate variability, training load, and estimated sweat loss) and a reliable heart rate monitor. These tools, combined with careful observation of your body’s signals and adherence to proven fueling protocols, remain the most practical approach for optimizing marathon performance. The future of sweat sensing is bright, but the present requires a pragmatic blend of current tech and smart training practices.
Don’t Miss Out! The Next Wave of Hydration Tech is Coming
Early adopters are already seeing the potential. Get ahead of the curve and be ready when accurate, integrated sweat sensors hit the market. Explore the latest GPS running watches and heart rate monitors now – your future self will thank you!
Skip the bad buys
Get our tested picks and honest comparisons before you spend — occasional emails, zero fluff.
Frequently Asked Questions
Are current smartwatches capable of measuring sweat composition?
No, not directly. While smartwatches like the Apple Watch Series 9 or Garmin Fenix 7 can measure heart rate, SpO2, and track movement using sophisticated sensors (e.g., Maxim Integrated MAX 30101 for PPG, Bosch BHI260AP for motion), they do not possess the specific electrochemical or optical sensors required to analyze the electrolyte or metabolite content of sweat in real-time. They can *estimate* sweat loss based on activity data and environmental conditions, but this is an indirect calculation, not a direct measurement.
How accurate are consumer sleep trackers compared to medical polysomnography?
Consumer sleep trackers, which primarily use accelerometers and heart rate sensors, show moderate agreement with polysomnography (PSG), the clinical gold standard. Studies typically report accuracies ranging from 70% to 85% for distinguishing between sleep and wakefulness. However, their ability to accurately differentiate between sleep stages (light, deep, REM) is significantly lower, often falling below 60% compared to PSG’s highly accurate classification based on EEG, EOG, and EMG data. They are useful for tracking general sleep duration and consistency but should not be relied upon for clinical sleep disorder diagnosis.
What are the main challenges for wearable sweat sensors?
Several hurdles exist: 1) Accuracy and Reliability: Achieving medical-grade accuracy for electrolytes like sodium (e.g., within ±5-10 mmol/L) is difficult in a small, wearable form factor. Sweat rate variability and skin contamination can affect readings. 2) Power Consumption: Continuous electrochemical sensing can be power-intensive, leading to short battery life, which is impractical for long endurance events. 3) Durability and Usability: Sensors must withstand sweat, friction, and movement without degrading. They also need to be easy to apply, calibrate, and interpret for the average athlete. 4) Cost: Advanced sensor technology is currently expensive, limiting accessibility.
Keep reading
